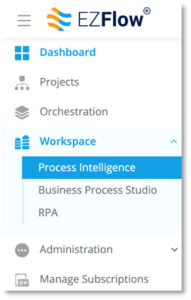
To open the Process Intelligence module, click the Workspace drop-down from the left toolbar, and then click Process Intelligence.
Process Intelligence helps you identify and choose the best areas for improvement. This module of the Workspace is where we combine business intelligence and process mining to provide an accurate visual representation of a business process.
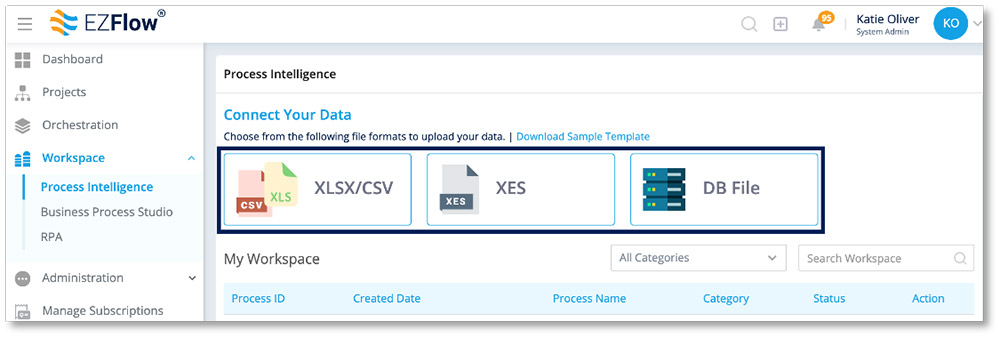
To do this, EZFlow helps you systematically discover and collect process details from multiple systems to create a log of events. To get things started, you’ll need to upload some data.
When you open the module, you’ll see three options for uploading your data.
Uploading Data
To upload data, you’ll first select your file format.
Uploading XLSX/CSV
- Hover over the corresponding option, click the cloud and upload your file
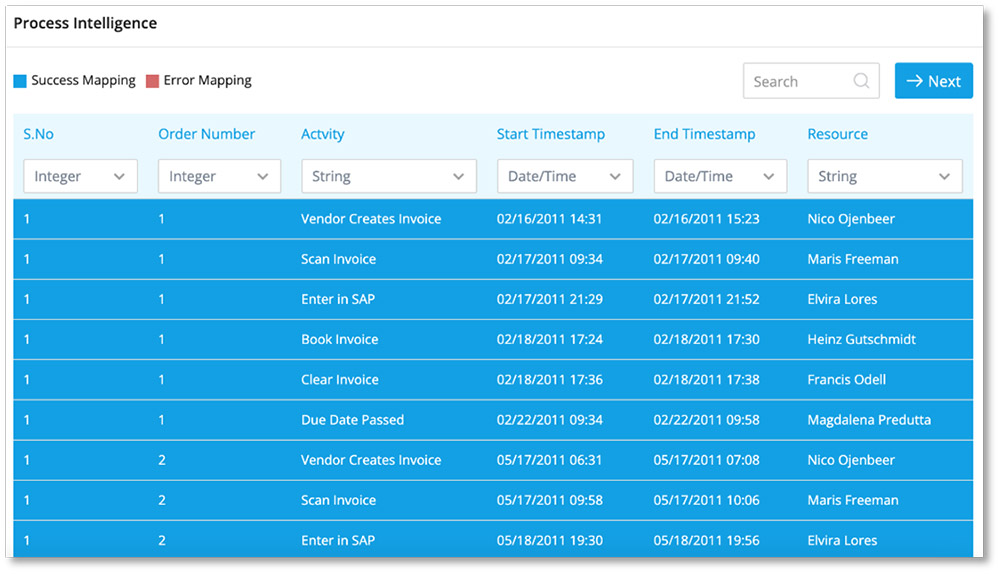
- EZFlow will upload and validate your data so it’s ready to be used.
- If any data is unable to be mapped, EZFlow will identify the data in red
- To streamline your formatting, download the sample CSV
- Once all your values are validated, you’ll see a table with your data

- Click Next in the upper right corner
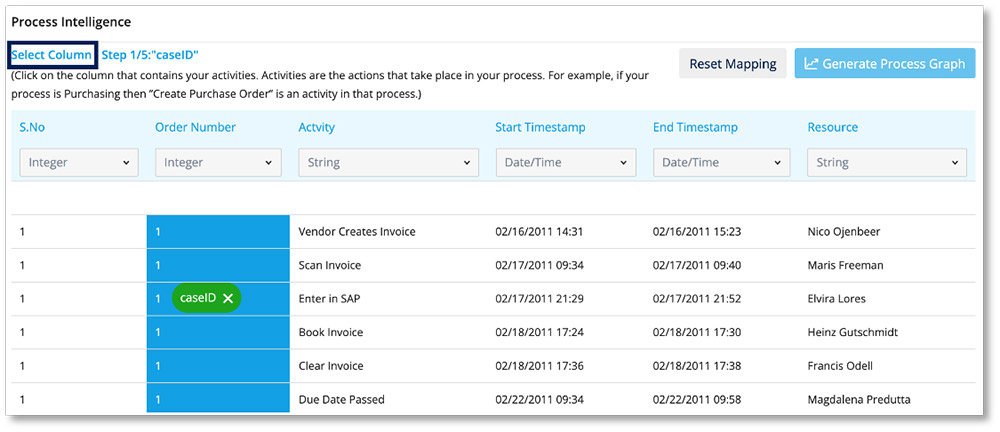
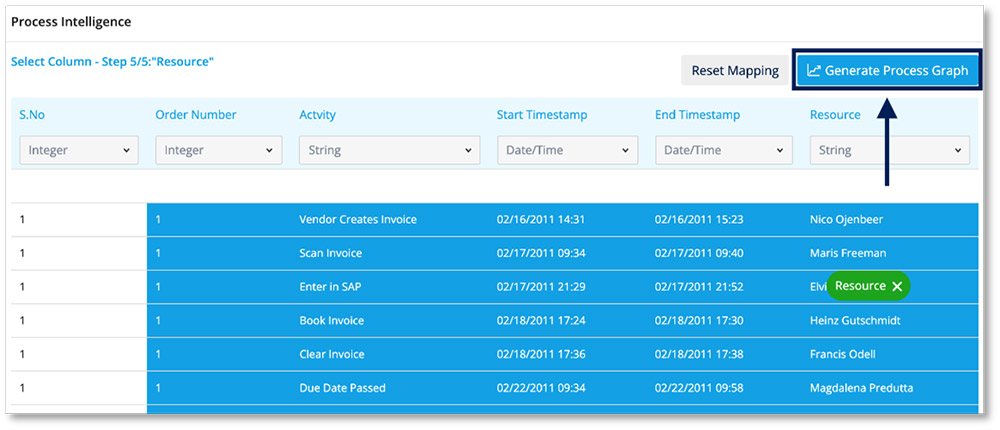
- Here, you’ll map your data by clicking on the corresponding columns

- Click Generate Process Graph to move on to the next step. This can take a few minutes. In the meantime, your graph will show as In Progress on your main Process Intelligence workspace.

Uploading XES
- Hover over the corresponding option, click the cloud and upload your file
- EZFlow will upload and validate your data so it’s ready to be used.
- If any data is unable to be mapped, EZFlow will identify the data in red
- To streamline your formatting, download the sample CSV to see the corresponding fields
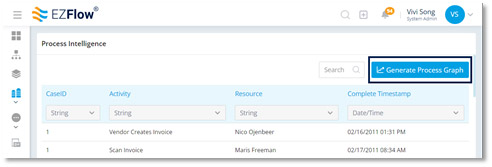
- Once all your values are validated, you’ll see a table with your data
- Click Generate Process Graph to move on to the next step
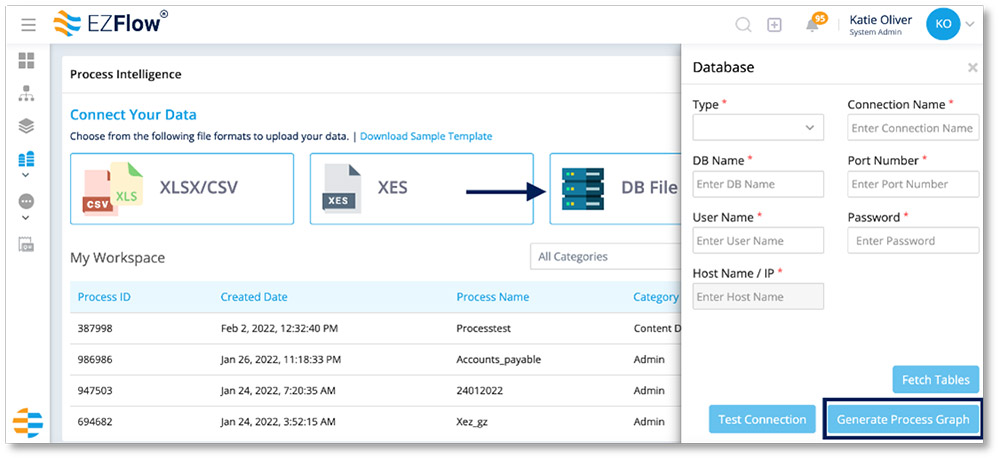
Uploading Database Files
- First, you need database details and credentials
- Click DB File and then the create icon to open the database credentials window
- Fill in the appropriate fields
- With your form filled, you can then click Fetch Tables to retrieve specific data if needed, otherwise, move on to Generate Process Graph
- Click Generate Process Graph to move on to the next step
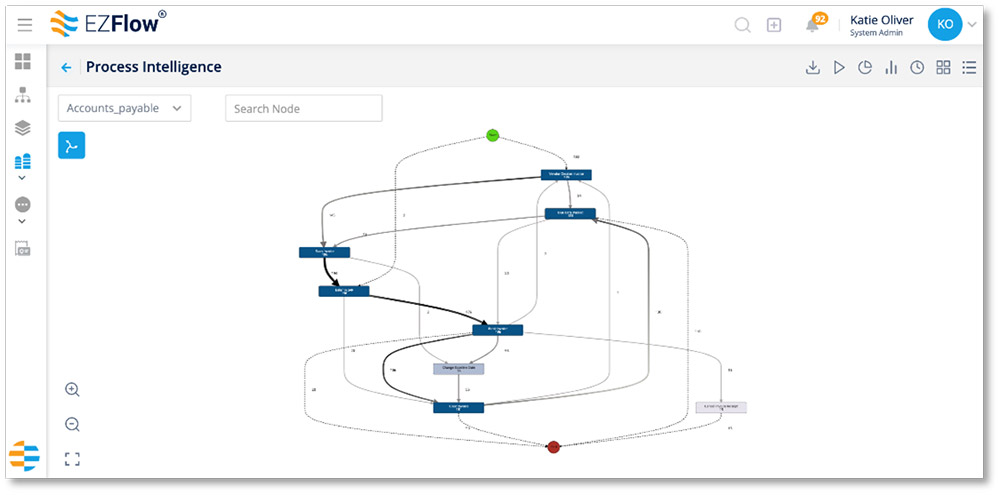
Process Graph: The Big-Picture View
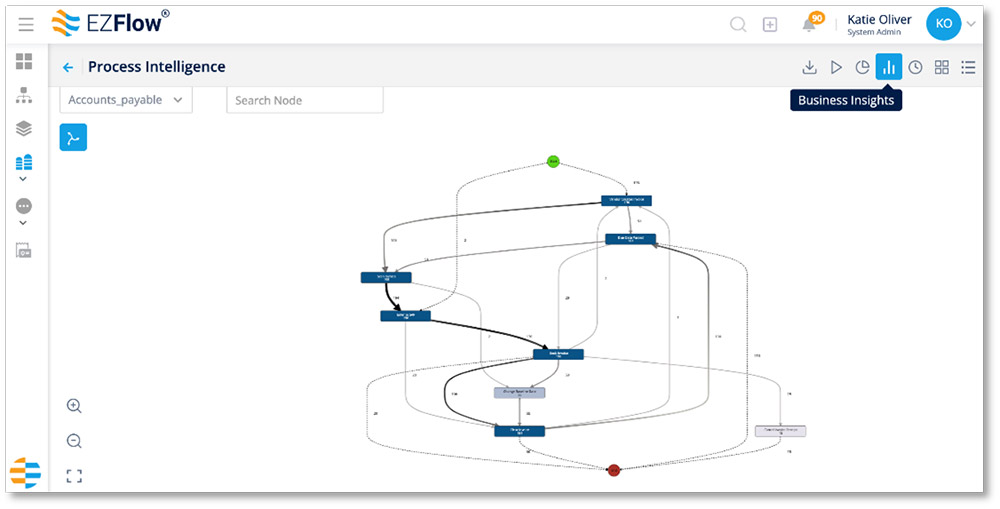
Once you’ve uploaded your process data, EZFlow draws it into a visual map that offers a big-picture view that exposes bottlenecks and deviations from the process goals.
You can download your graph at any time by clicking the download icon from the menu in the upper right corner.
You can also see what your workflow looks like in motion by clicking the play icon . To stop, simply click the stop icon.

On the graph, you can identify compliance concerns, inefficiencies and more by looking at specific data, including:
- Time to complete each step in the process
- Number of repetitions in a task
- Frequency
- Duration
Zoom in and out with a pinch gesture on your mouse or trackpad to view specific segments of the graph more closely. All the steps in the process are labeled within the graph.
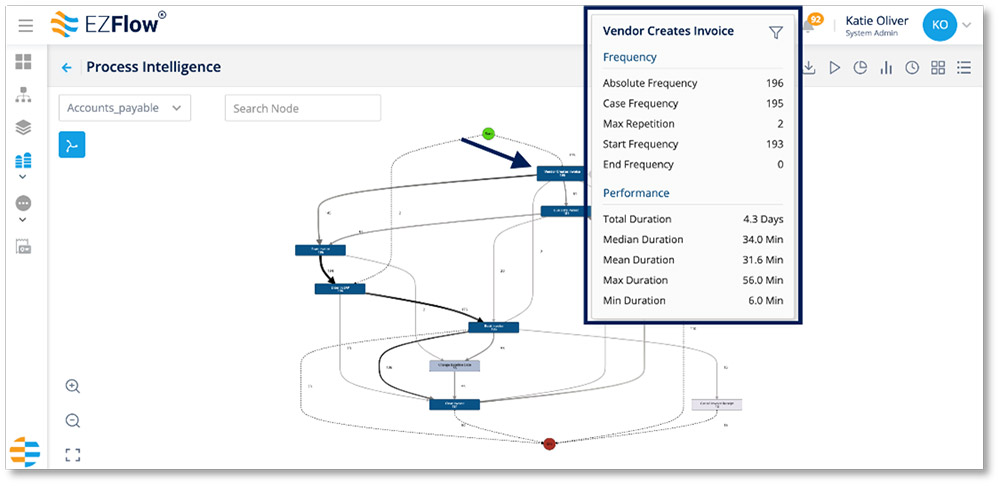
Hover over any step to see the frequency and performance metrics.
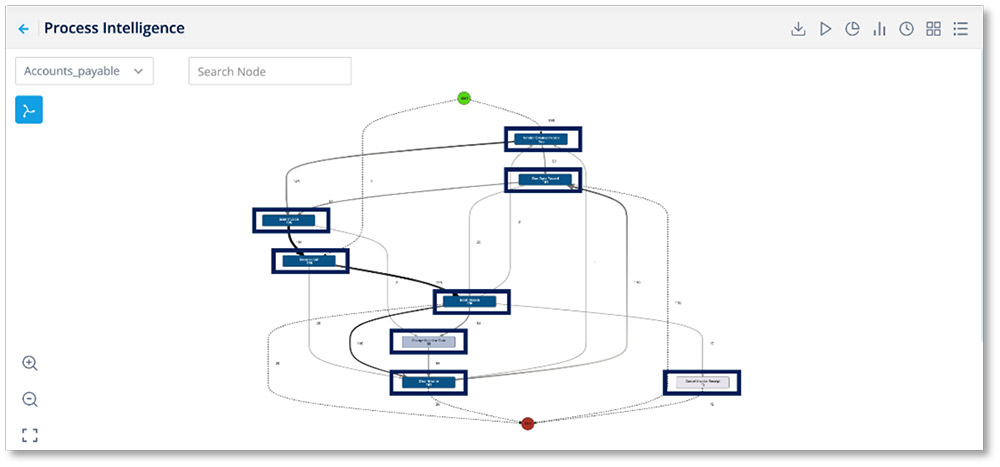
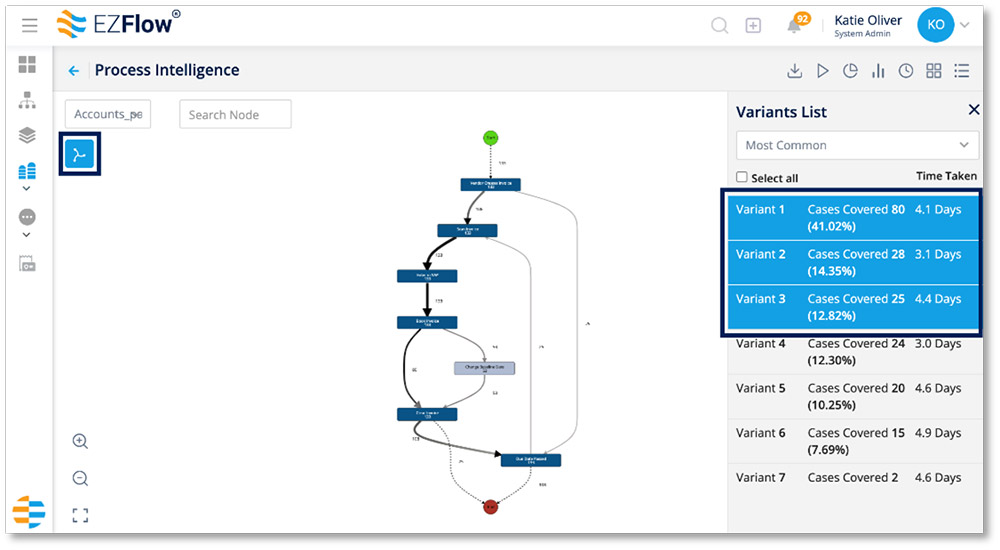
To view process variants—the different versions of your process, each with a unique path from the beginning through the end—click the bulleted list icon in the upper right corner.
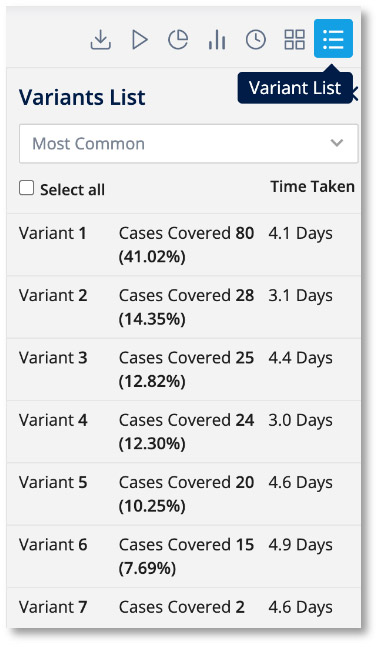
From here, EZFlow will produce a list of process variations you can explore. View one at a time, select multiple, or view them all. When the variants are selected, the visual will reflect a more focused process graph featuring data from only the selected variants.
For example, you might want to evaluate the max duration of certain steps to have a better understanding of how efficiently—or not—things are working at various stages of the workflow.
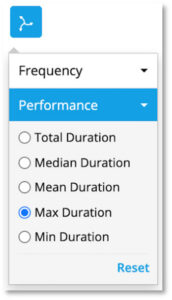
To do this, click the spinner icon on the left side of the process graph.
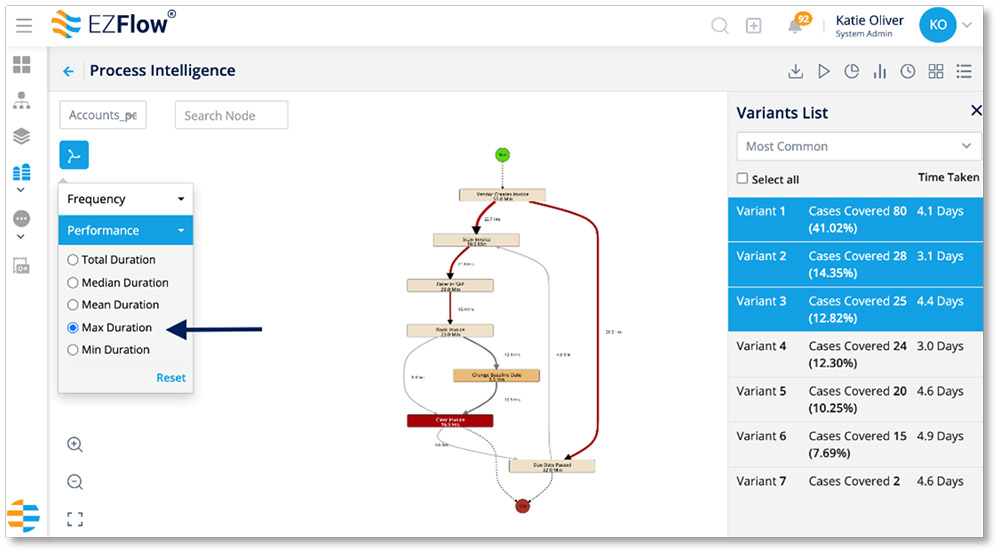
Select the performance drop-down and then select Max Duration.
Next, you’ll see the maximum amount of time each segment in the process takes. Zoom in and out to explore the graph as needed.
You can complete this same process for any of the performance metrics.
- Total Duration: The total amount of time it takes to complete a given step
- Median Duration: The median (middle) time it takes to complete a given step
- Mean Duration: The average time it takes to complete a given step
- Max Duration: The maximum amount of time it takes to complete a given step
- Min Duration: The minimum amount of time it takes to complete a given step
Process Insights
Within the graph view, you can also explore Process Insights. This is where you can see the potential impact of your automations before you make them, which will help you make data-driven decisions.
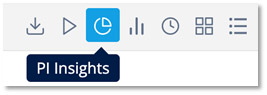
To explore insights, click the pie chart icon from the menu in the upper right corner.
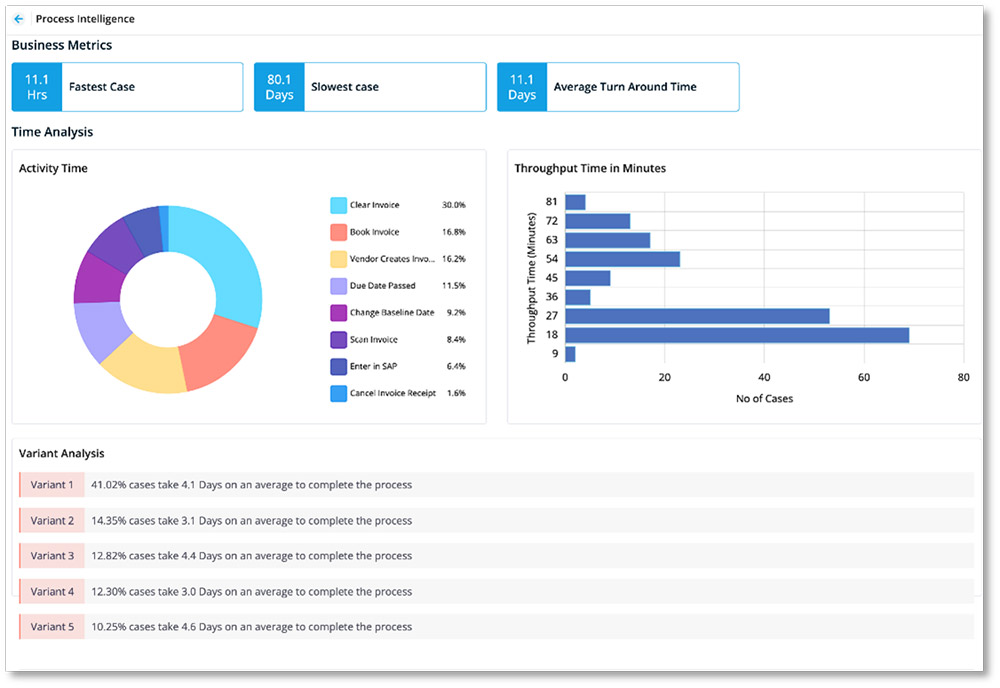
The next screen distills all your data into comprehensive business insights, highlighting a variety of cost breakdowns and analyses.
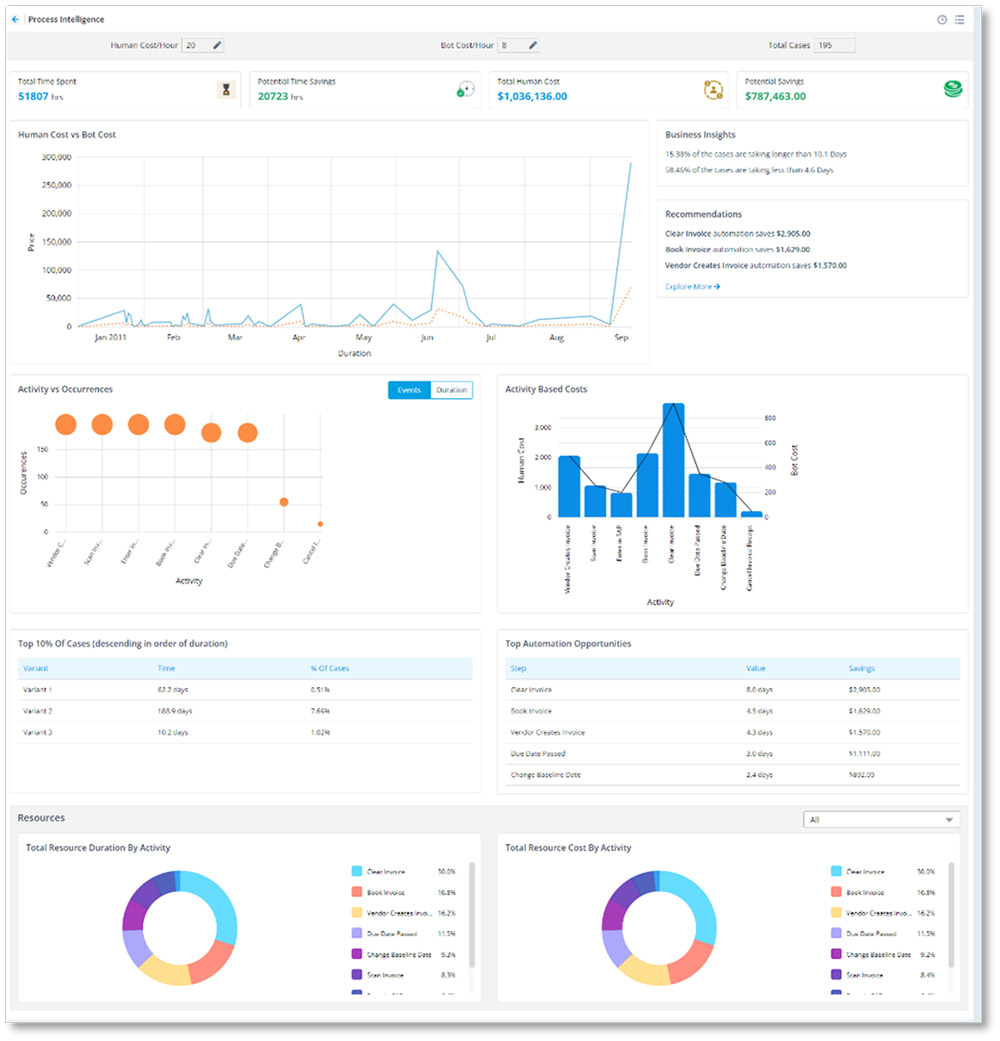
Enter the costs of human work and bot work accordingly, by clicking the edit button in those fields.
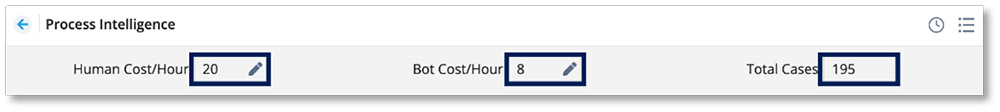
EZFlow will then compare these and identify how much you can potentially save by automating any given task.
From this screen, you also get an overview of Business Insights and Recommendations. This snapshot will show you the most significant bottlenecks and recommendations for gaining the most efficiencies and cost savings with automation.
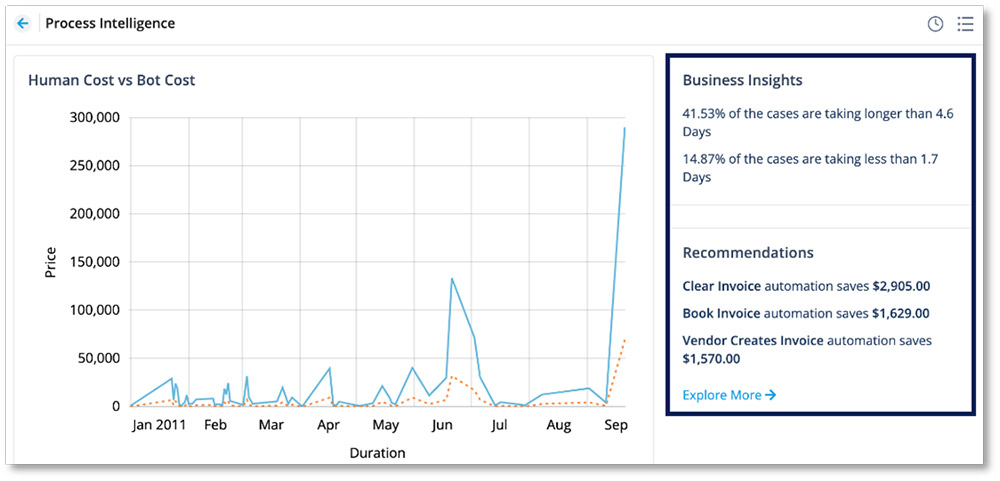
To explore these insights, click Explore More from the Recommendations section, or click the bar graph icon from the menu.
With these insights in hand, you can find the best opportunities for automation, leading to a measurable increase in productivity, efficiency and savings.
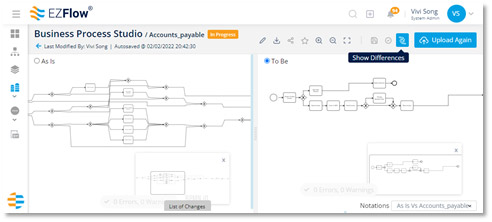
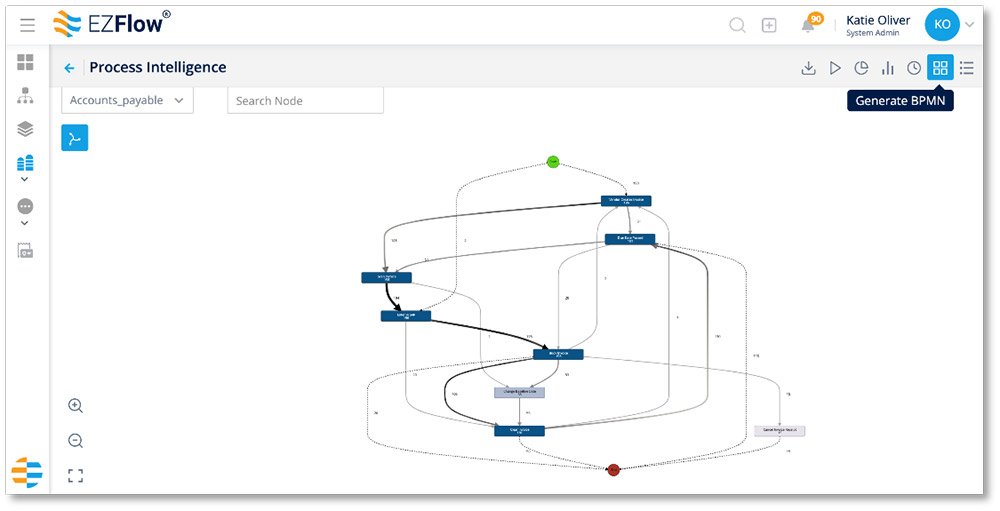
Converting a Graph to a BPMN
Once you have a solid handle on your current opportunities within the process, you can convert your process graph into an industry-wide standard Business Process Model Notation (BPMN) by clicking the block icon.
EZFlow will automatically send your BPMN to the Business Process Studio, where you can begin building your ideal process using your existing as-is data.
To compare your as-is process with your to-be process, after generating your BPMN, click the arrow icon to Show Conformance. This will highlight the changes between the as-is and to-be processes.